

The device page
The device page shows all the readings, outputs, chart and settings of a device. To open it, click Open device on its card in the device list.
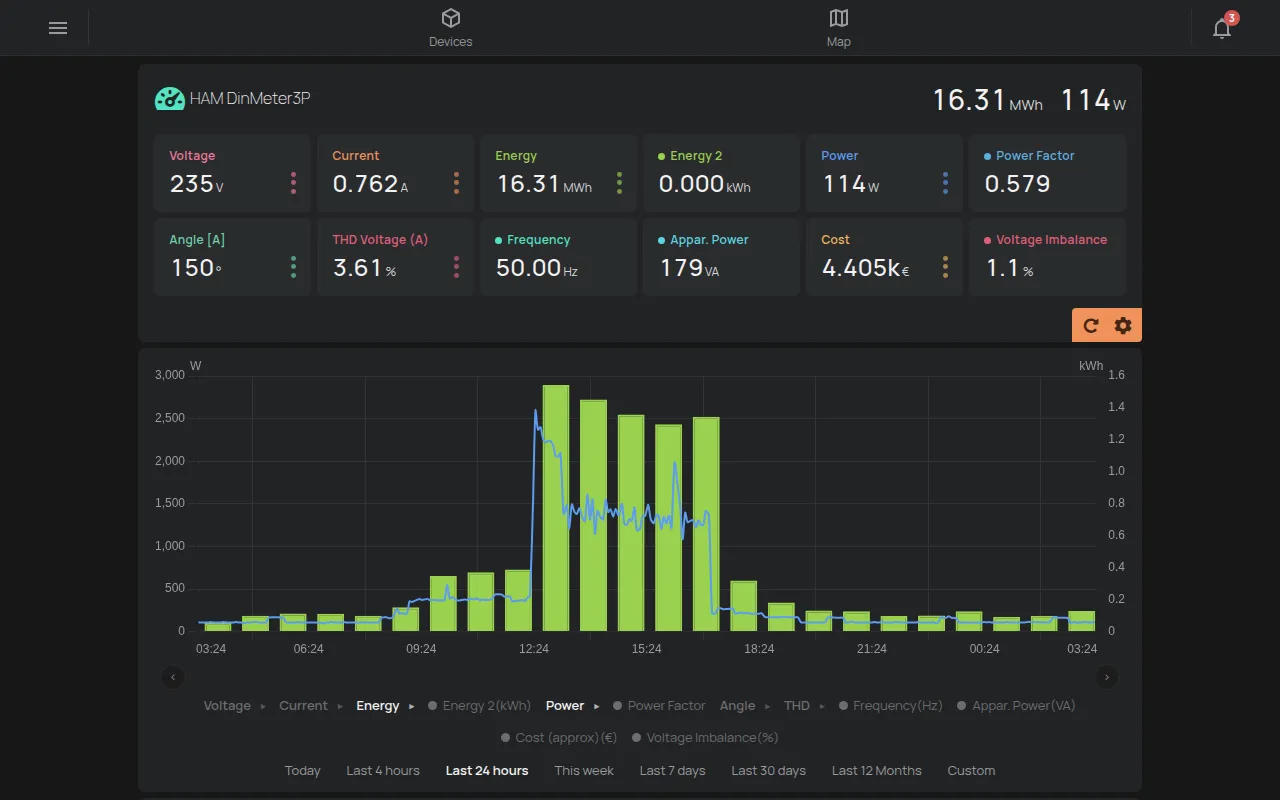
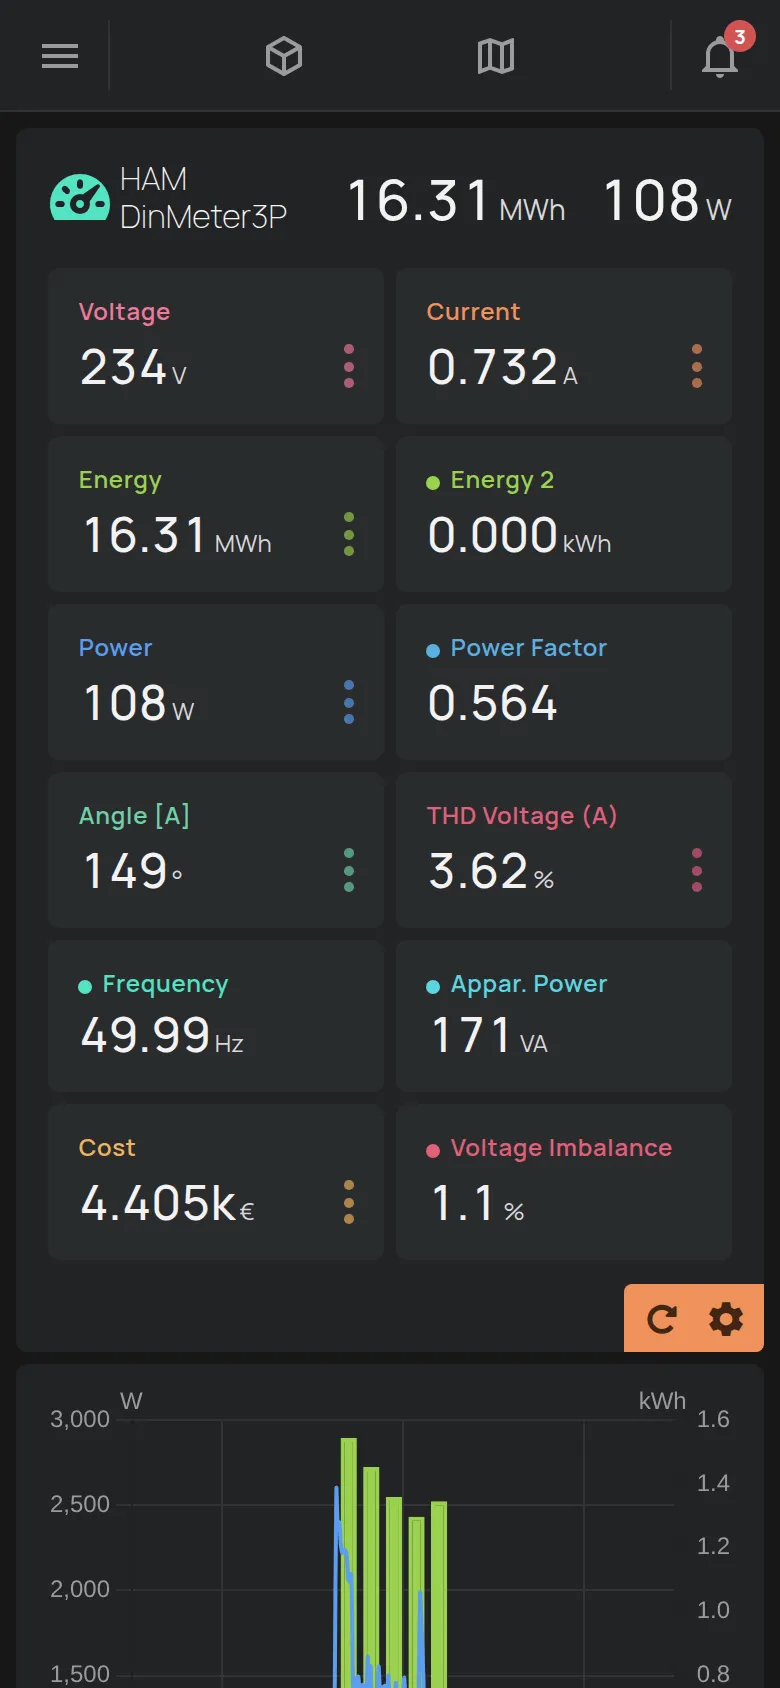
The header
Section titled “The header”- The icon and the name of the device. If the device has no name, the serial number shows, for example
e12:57. - One or two main readings, on the right.
- The outputs of the device, if it has outputs. See output controls.
- Signs for the connection, the warnings and the alarms.
Warnings and alarms
Section titled “Warnings and alarms”The Warnings icon shows a problem that the platform found on the device. Click it to see the problem. Click Learn more for more information.
The Device alarm icon shows that the device is in an alarm state. Click it to see the Active alarms list. A user with Manage access or the owner can click Clear alarms.
The readings
Section titled “The readings”Below the header, each reading has a cell. The cells update in real time.
Some readings also have values per period, for example energy per day, week and month. These values are together in one cell with three dots. Click the cell to see all the values.
The app hides two types of readings:
- technical information, for example the serial number, the IP and the signal strength,
- readings that have no value yet.
To show a hidden reading, use edit mode.
Refresh the readings
Section titled “Refresh the readings”There are two buttons in the corner of the section. Refresh asks the device to send its readings now. The gear Edit opens edit mode.
Edit mode
Section titled “Edit mode”Edit mode changes the name of the device and how the readings show.
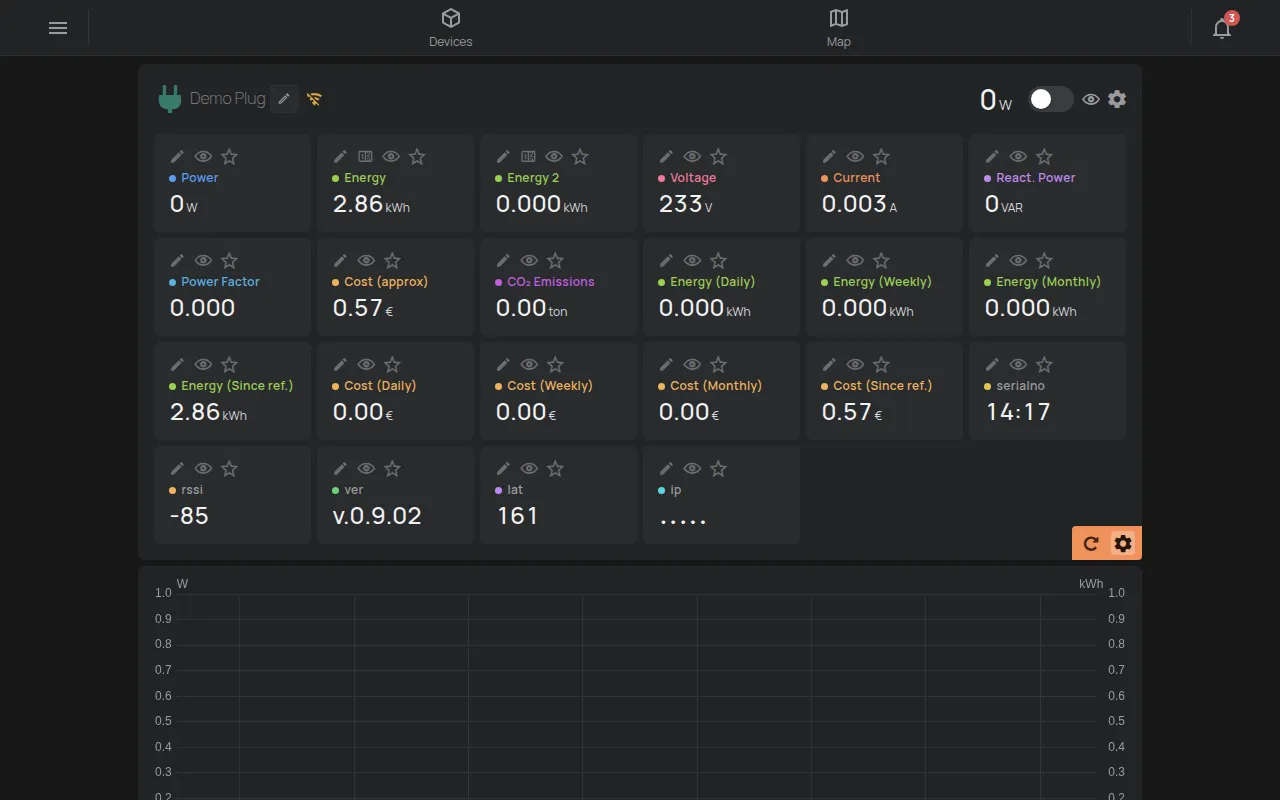
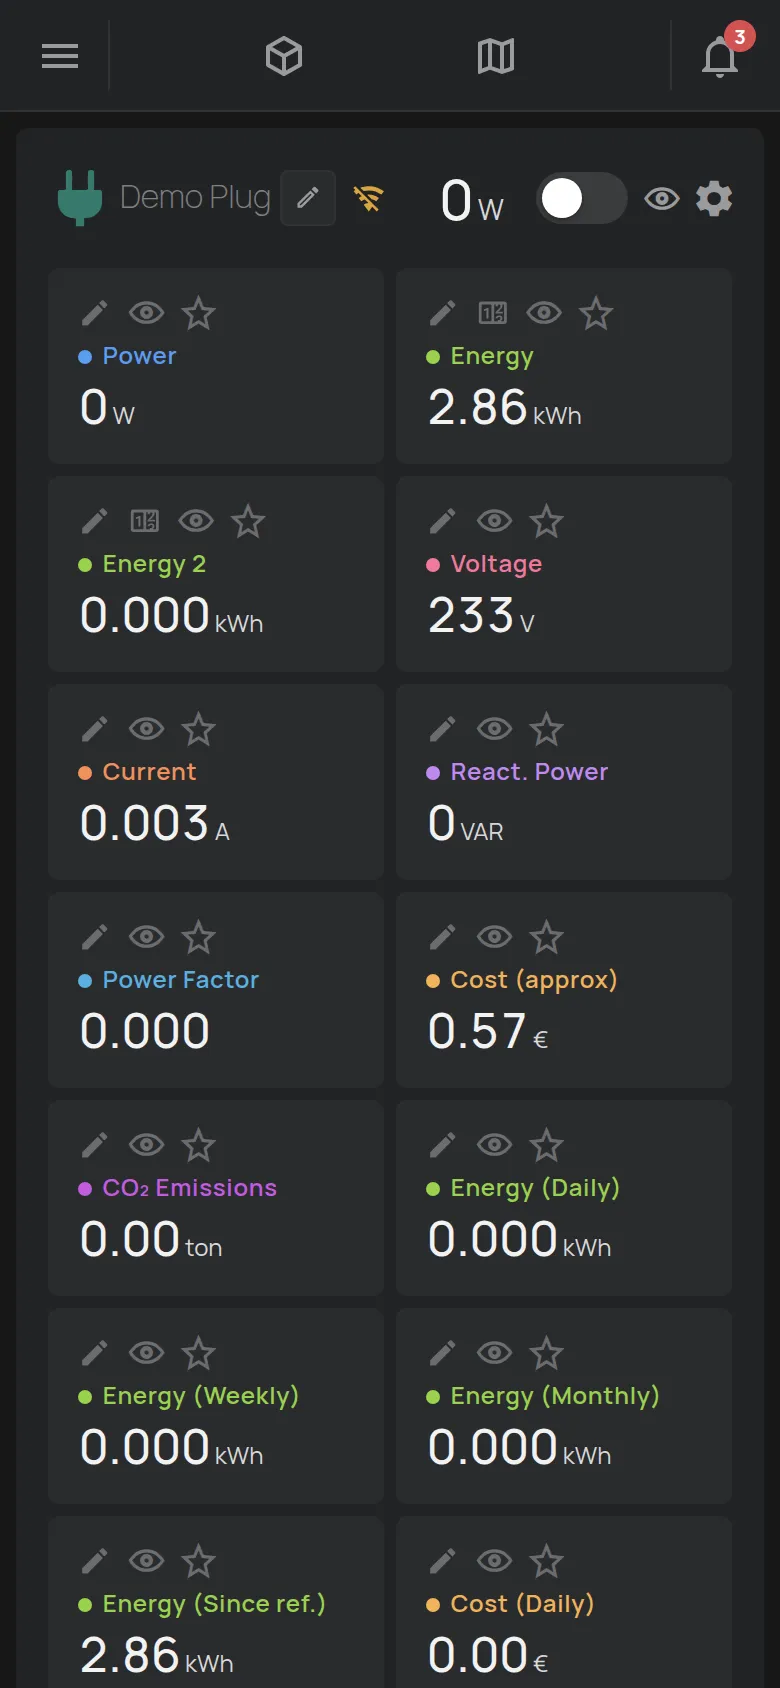
- Click the gear Edit in the corner of the readings.
- Make the changes with the tools on each cell.
- Click Done to leave edit mode.
The tools on each cell:
- Pencil Rename: changes the name of the reading.
- Eye: switches the visibility of the reading between default, hidden and shown.
- Star: puts the reading in the header and on the card in the list. You can select up to 2 readings. If you select a third, the oldest selection is removed.
- Edit value: sets the value of a counter, for example energy. It is only for readings that accumulate, and only for Manage access or the owner.
For digital inputs, a tool changes the names of the states, for example “closed” and “open”. For NFC cards and BLE tags, the Name this UID tool gives a name to a card or a tag.
Change the name and the icon
Section titled “Change the name and the icon”- Click the gear Edit in the corner of the readings.
- Click the pencil next to the device name.
- Type the new Name. The name has up to 32 characters.
- Select an Icon. The Filter… field finds an icon.
- Click Save.
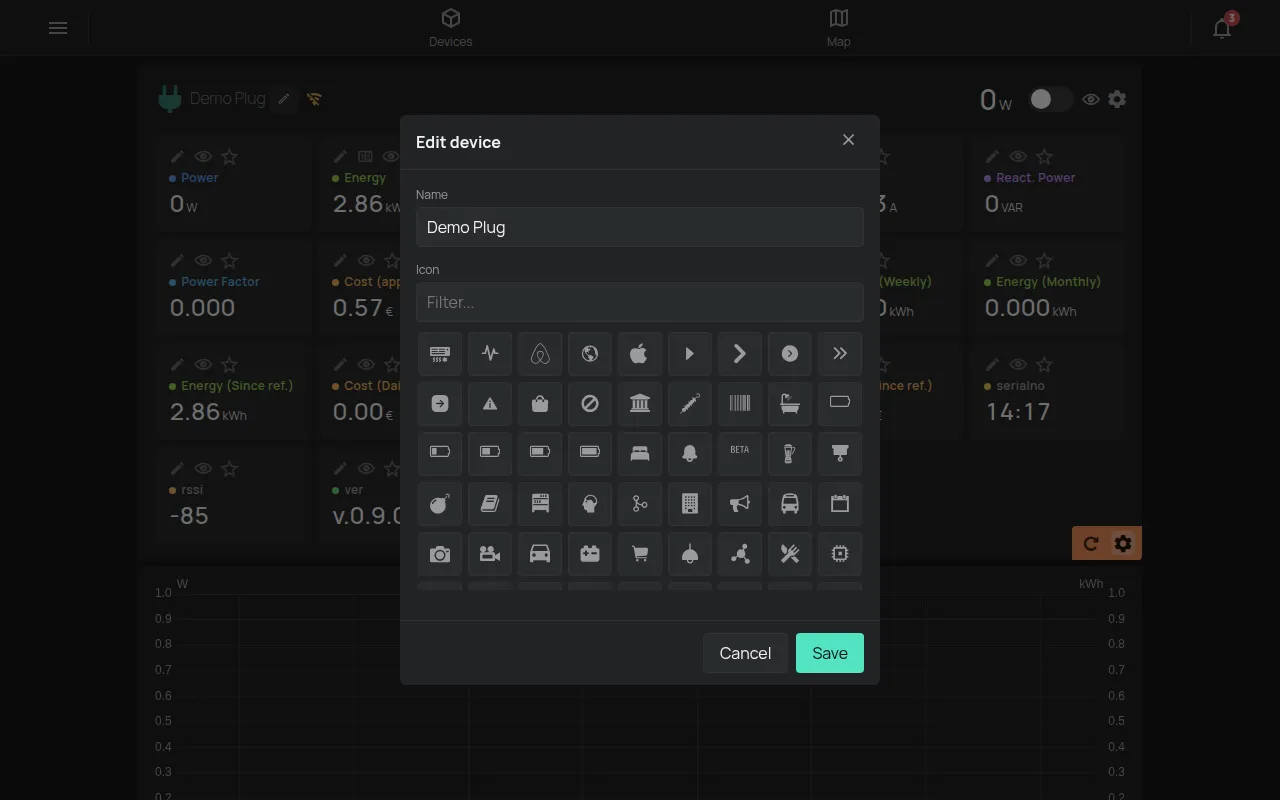
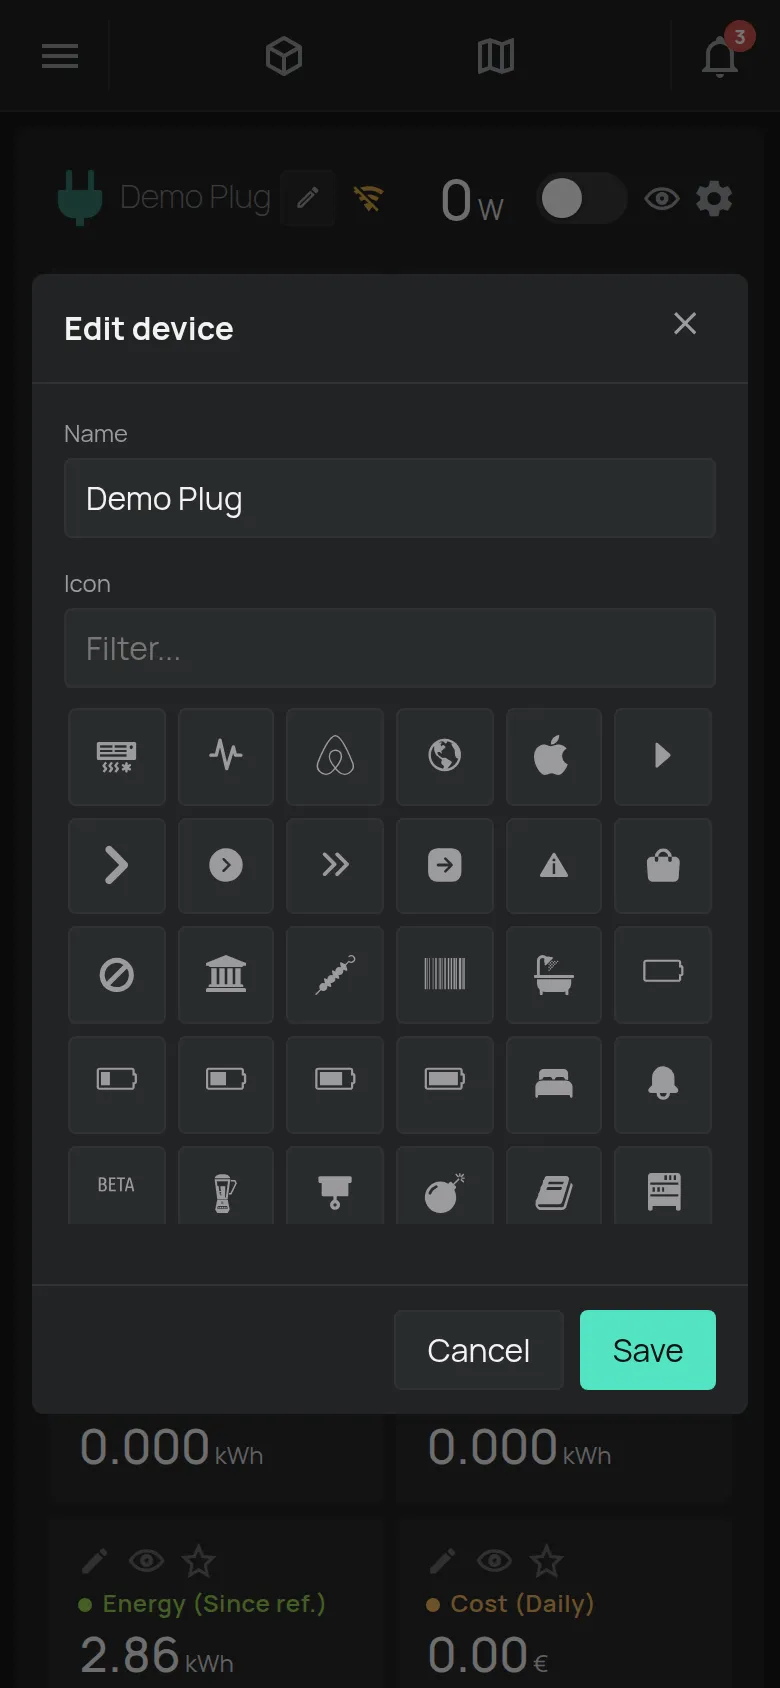
The message “Saved” confirms the change.
The sections below the chart
Section titled “The sections below the chart”Below the chart there are sections that open with one click:
- Settings: see device settings.
- Access and Sharing: see sharing.
- Reports: see reports.
- Notifications and Automation: see schedules and create a rule.
- Firmware: the firmware version and the connection of the device. This is always the last section.
The firmware of the device
Section titled “The firmware of the device”The Firmware section shows information about the firmware and the connection of the device.
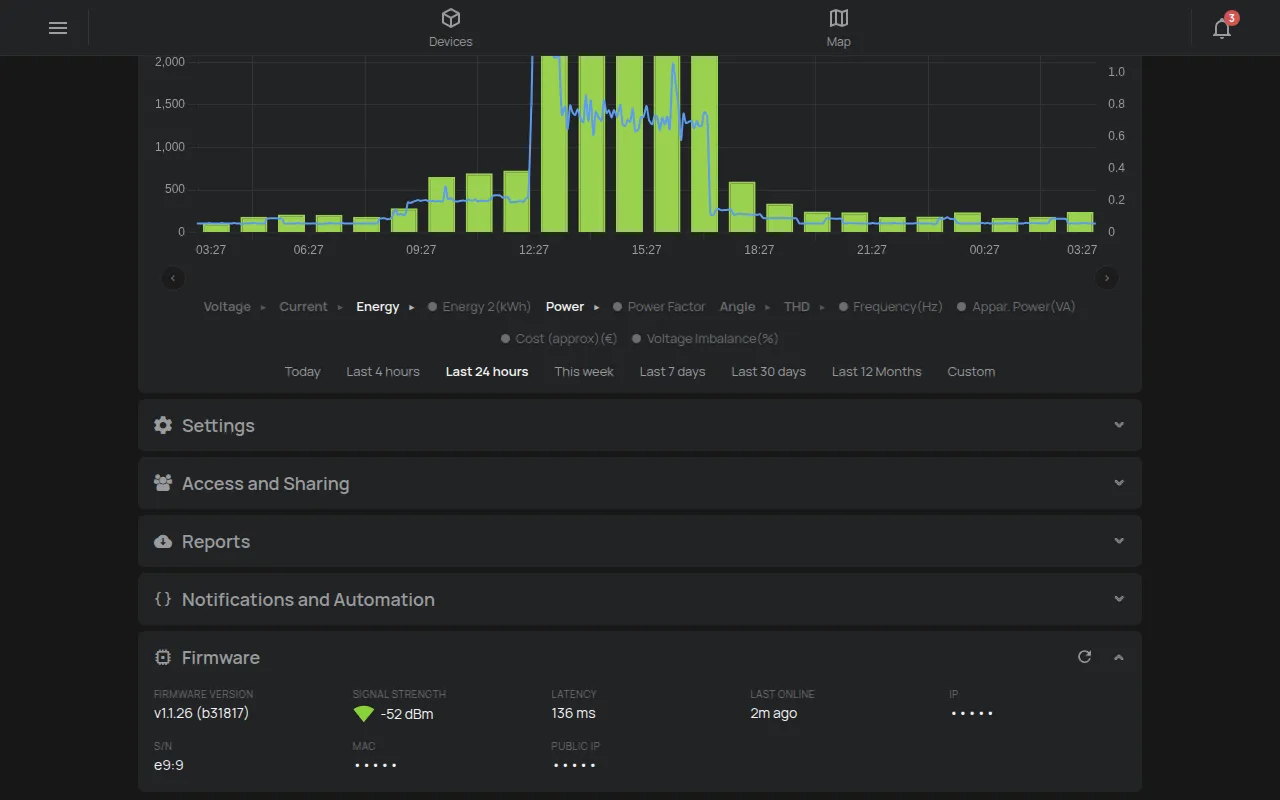
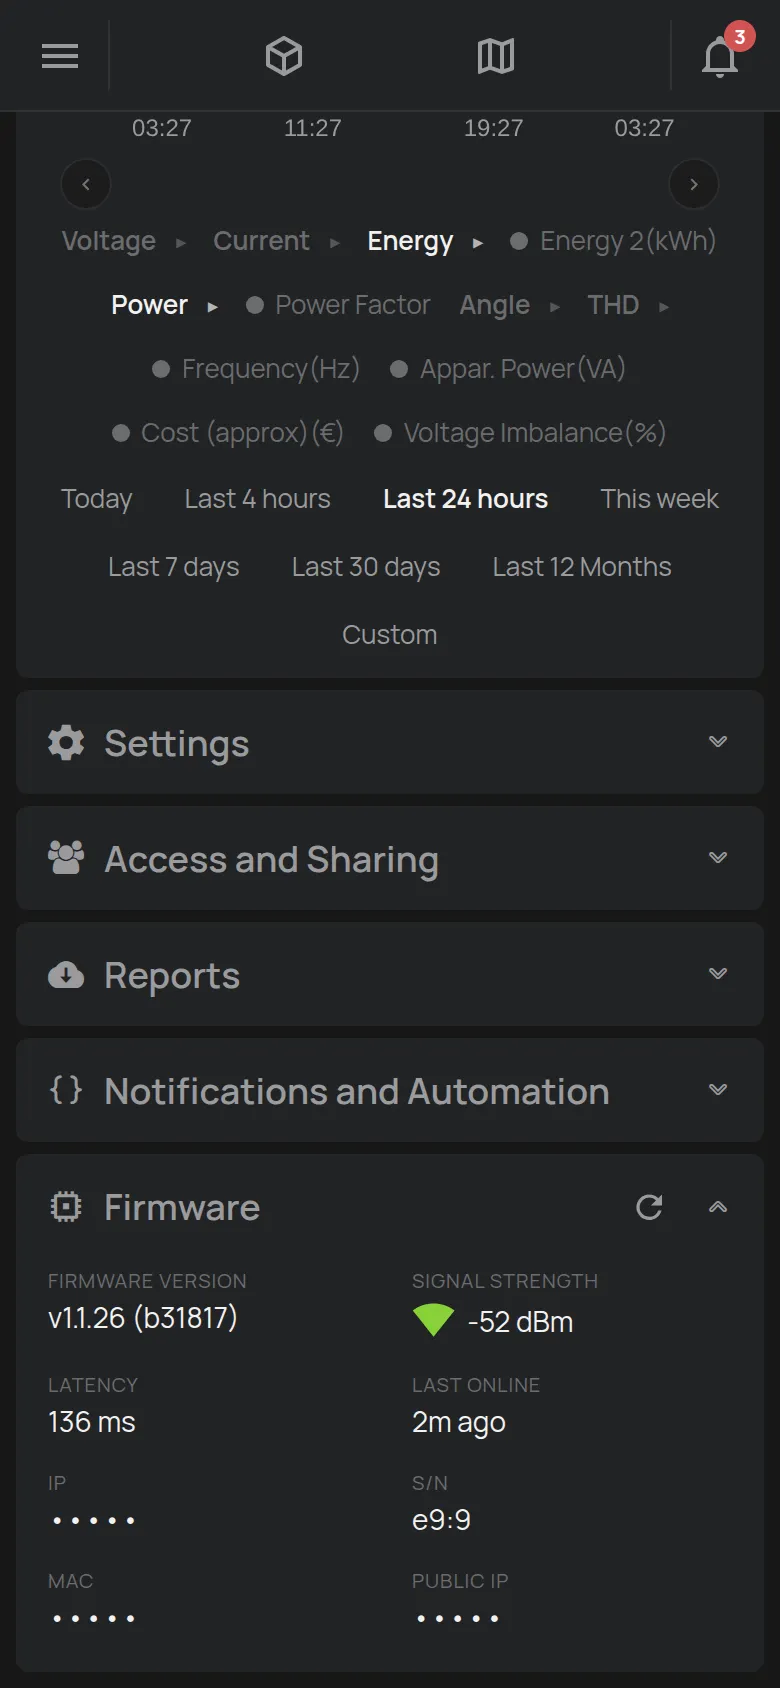
- Firmware version: the version on the device.
- Signal Strength: the WiFi strength in dBm. More green bars mean a better signal. One red bar means a weak signal.
- Latency: the response time of the device.
- Last Connection: when the device last connected.
- The IP address and the serial number (S/N).
- The MAC address and the Public IP, only for Manage access or the owner.
Devices with a SIM card also show the SIM card details and the network operator.
The app has no firmware update button. HAM Systems updates the firmware over the air (OTA) in two cases:
- When you ask for it.
- When a security patch is necessary. HAM Systems agrees with you first.
The device is not available for a few minutes during the update. Then the device card shows “Updating firmware”. For an update or for questions about the version, contact support.
The page for each type of device
Section titled “The page for each type of device”The page changes with the device. The readings, outputs and settings come from the product. These are examples.
Energy meter
Section titled “Energy meter”The meter shows power, energy, voltage, current and cost. In the chart, energy shows as bars and power as a line. See DinMeter3P.
Plug or switch
Section titled “Plug or switch”The plug shows the power and has a switch for the output.
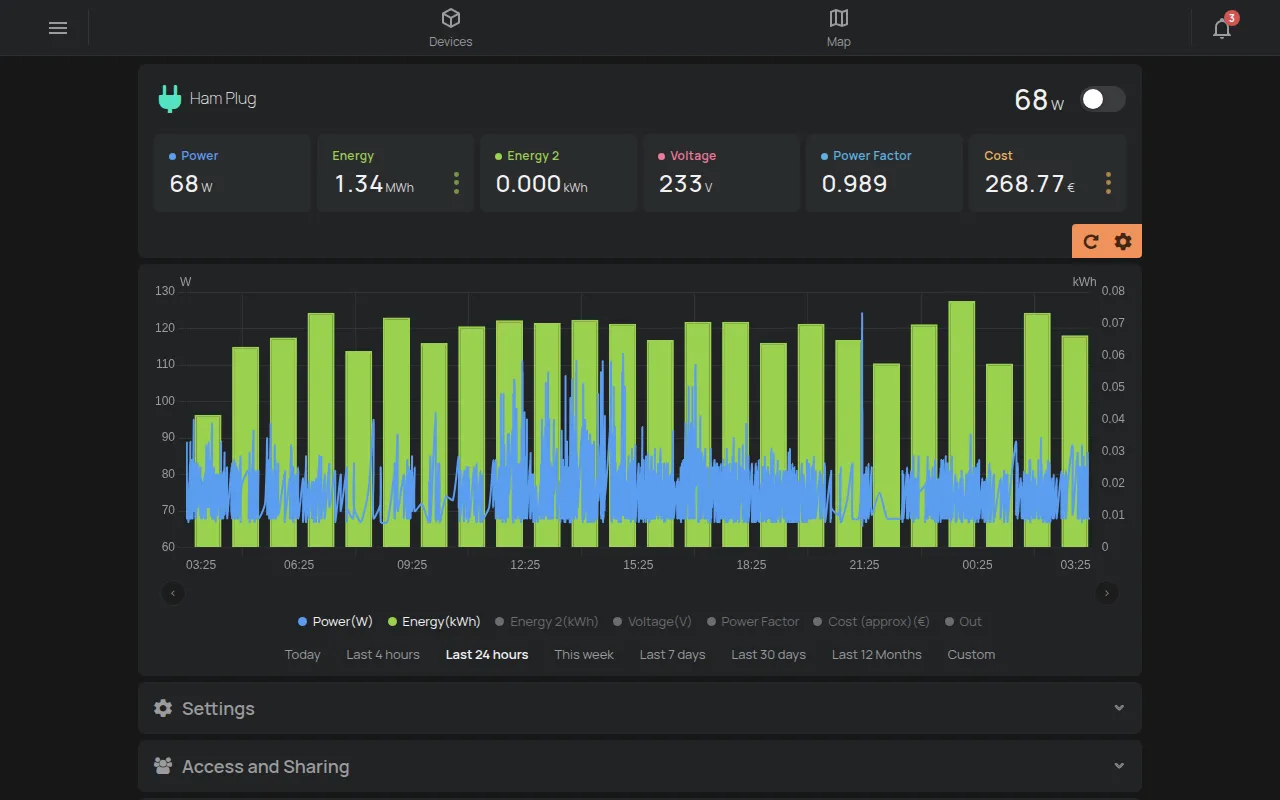
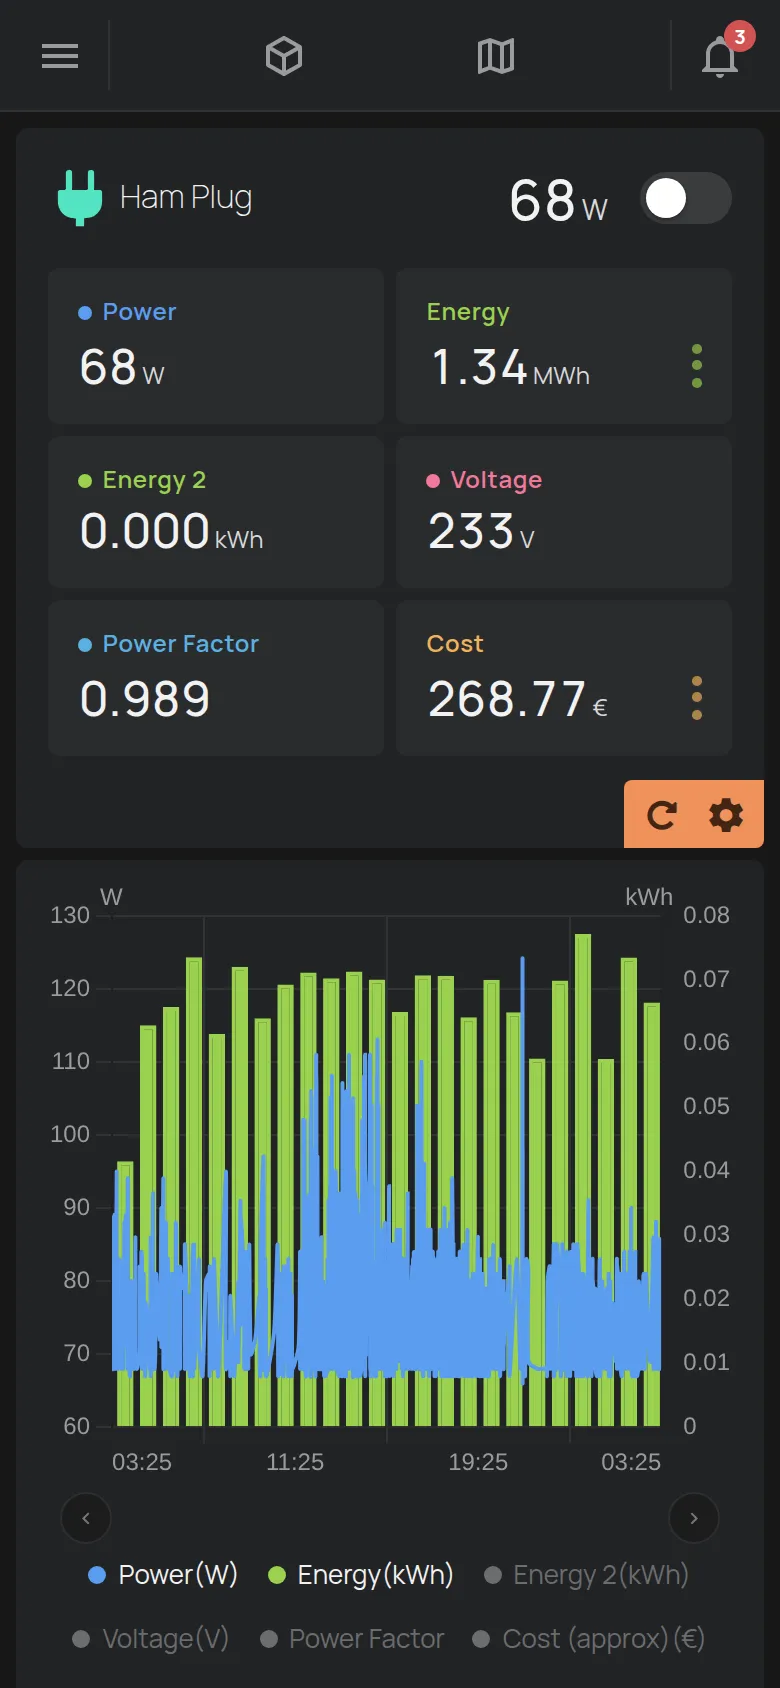
See HAM Plug and output controls.
Temperature sensor
Section titled “Temperature sensor”The sensor shows temperature and, on some products, humidity. It has no outputs.
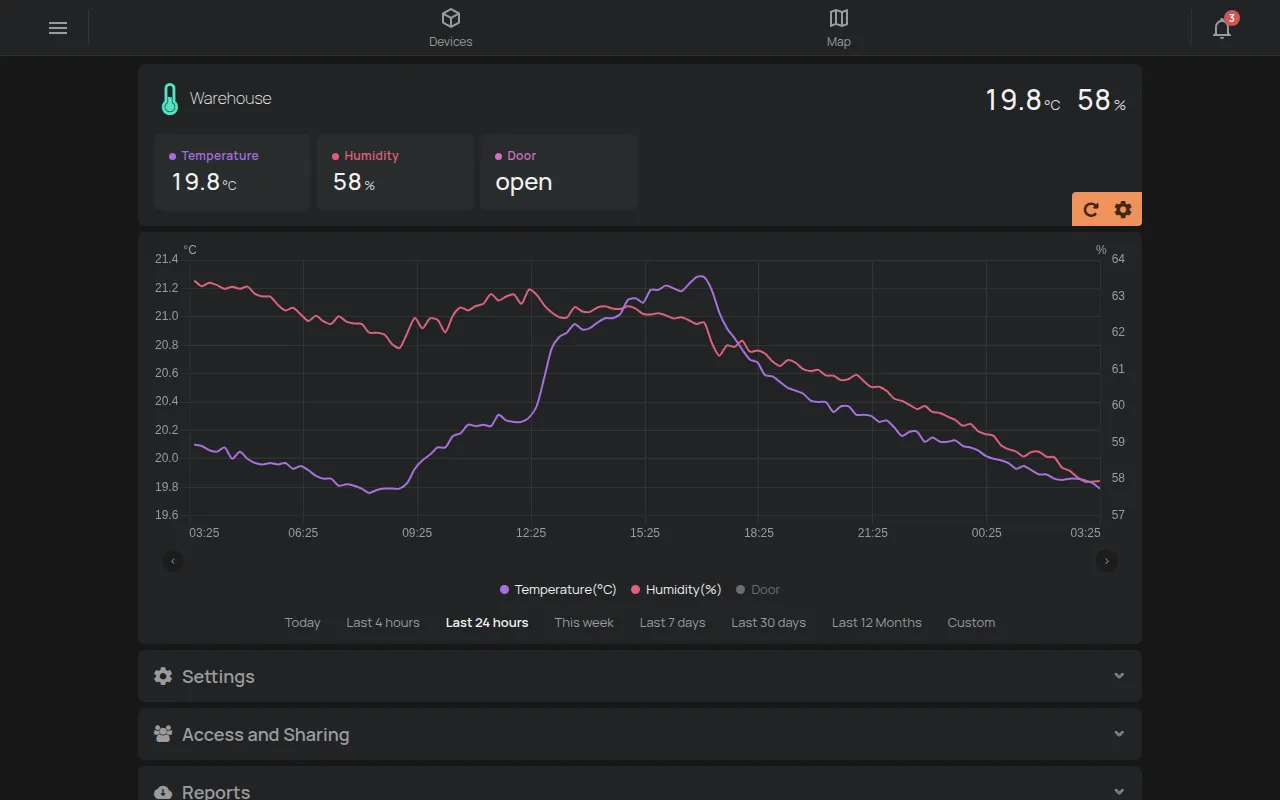
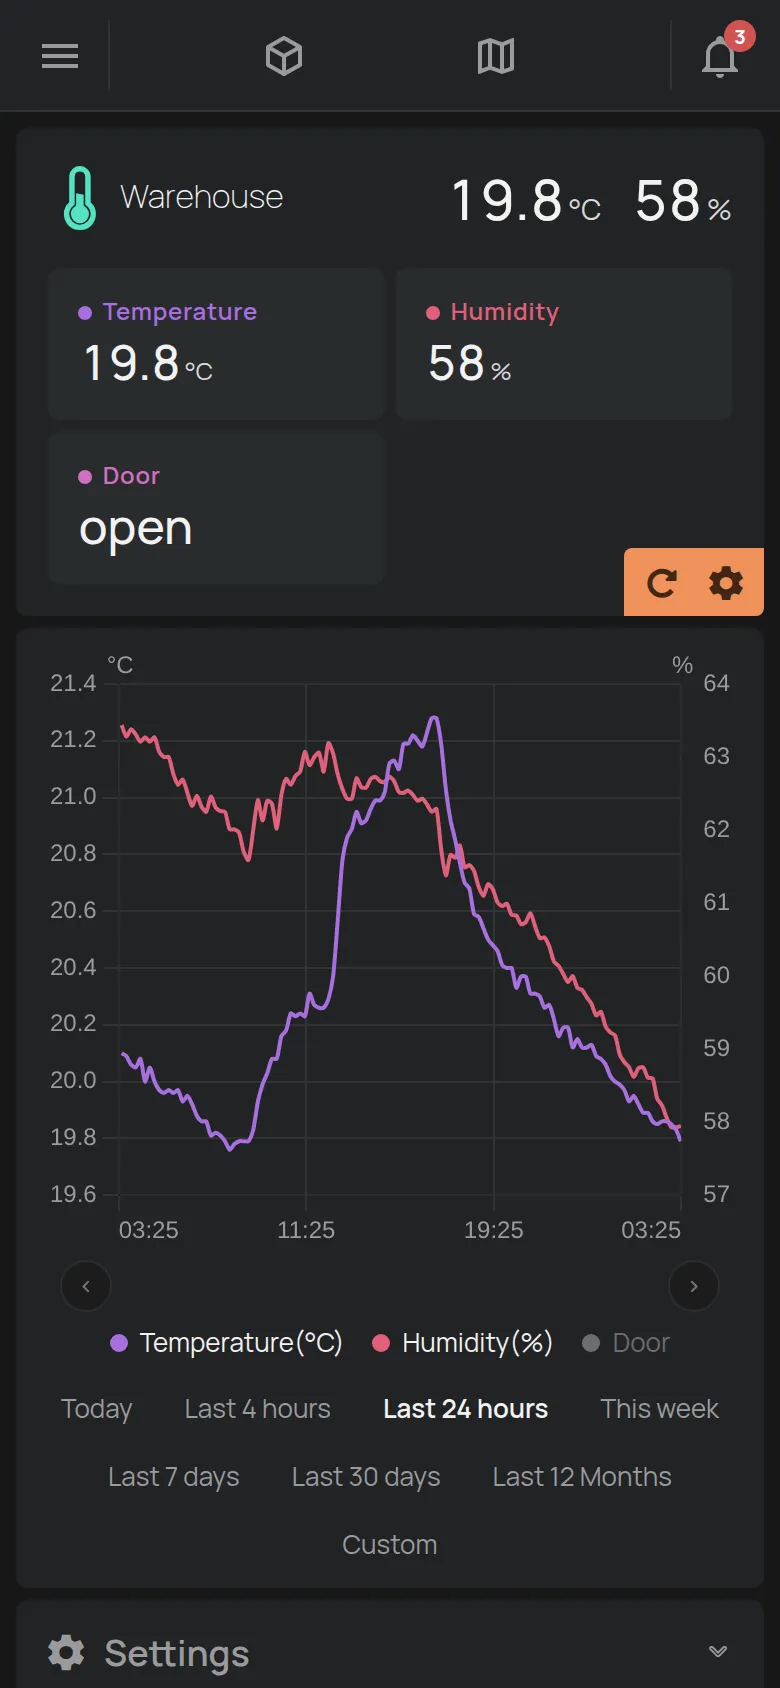
See the device catalogue.
Thermostat
Section titled “Thermostat”The thermostat has buttons for the mode, for example OFF, COOL, HEAT and AUTO. The slider with the − and + buttons sets the target temperature.
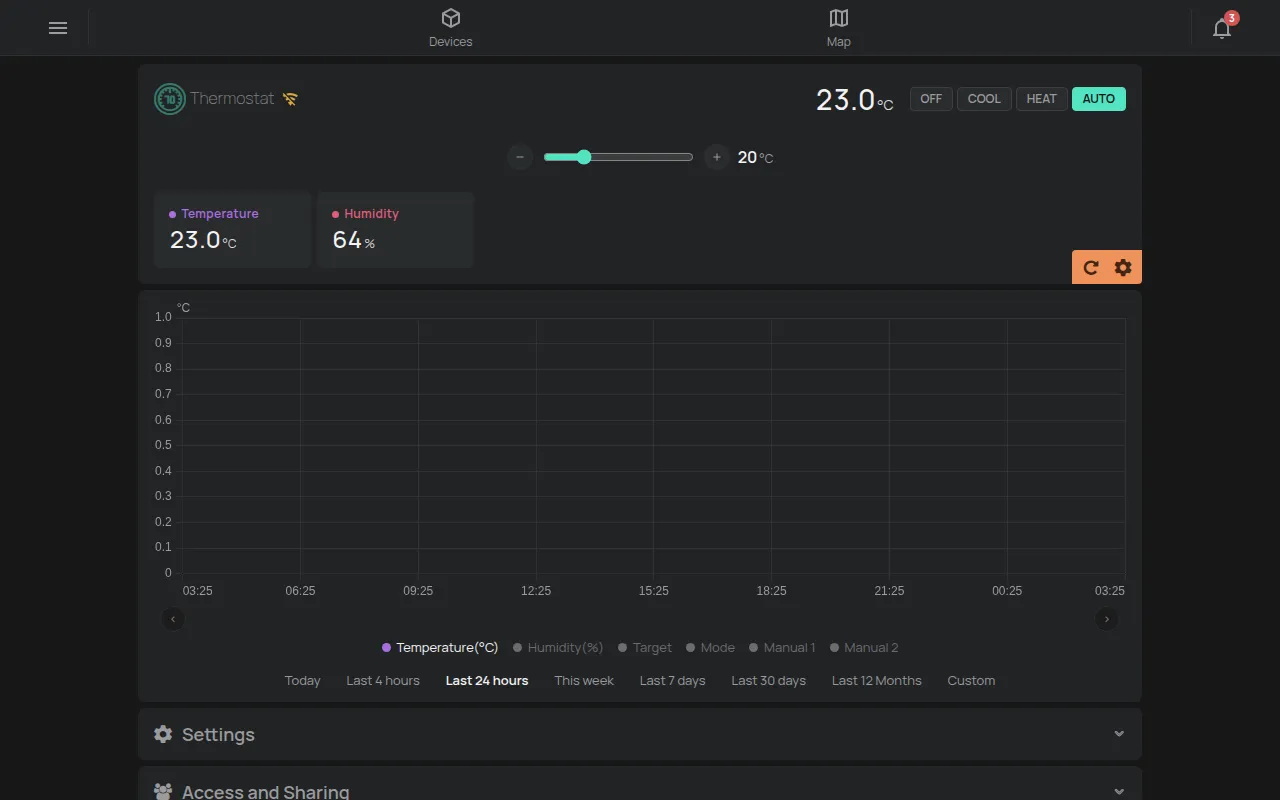
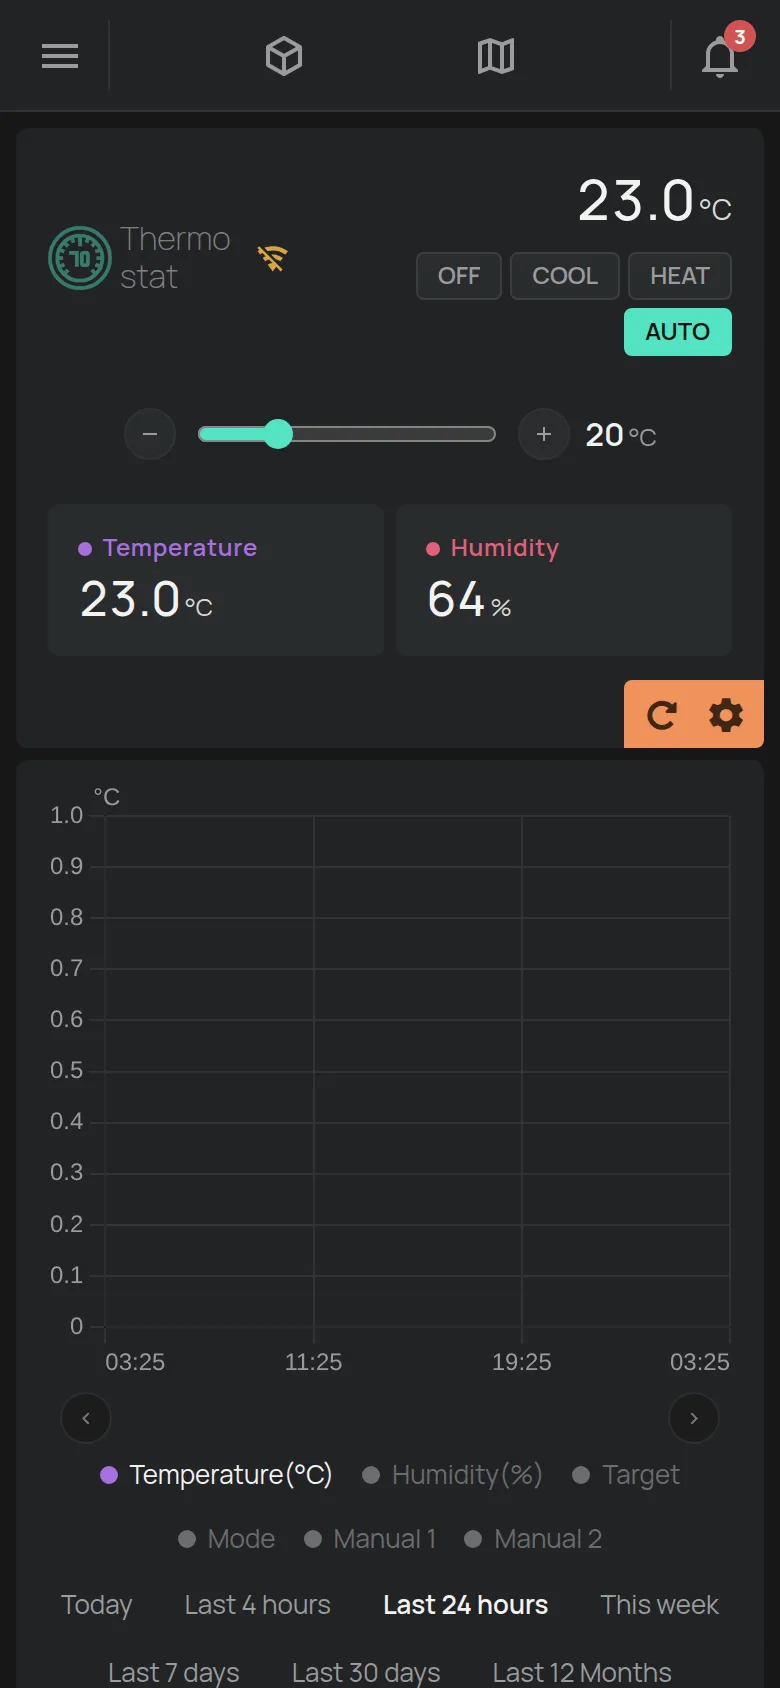
See Thermostat.
Air conditioner
Section titled “Air conditioner”RemoteAC controls an air conditioner with infrared. The page has buttons for the mode, the temperature, the fan and the swing.
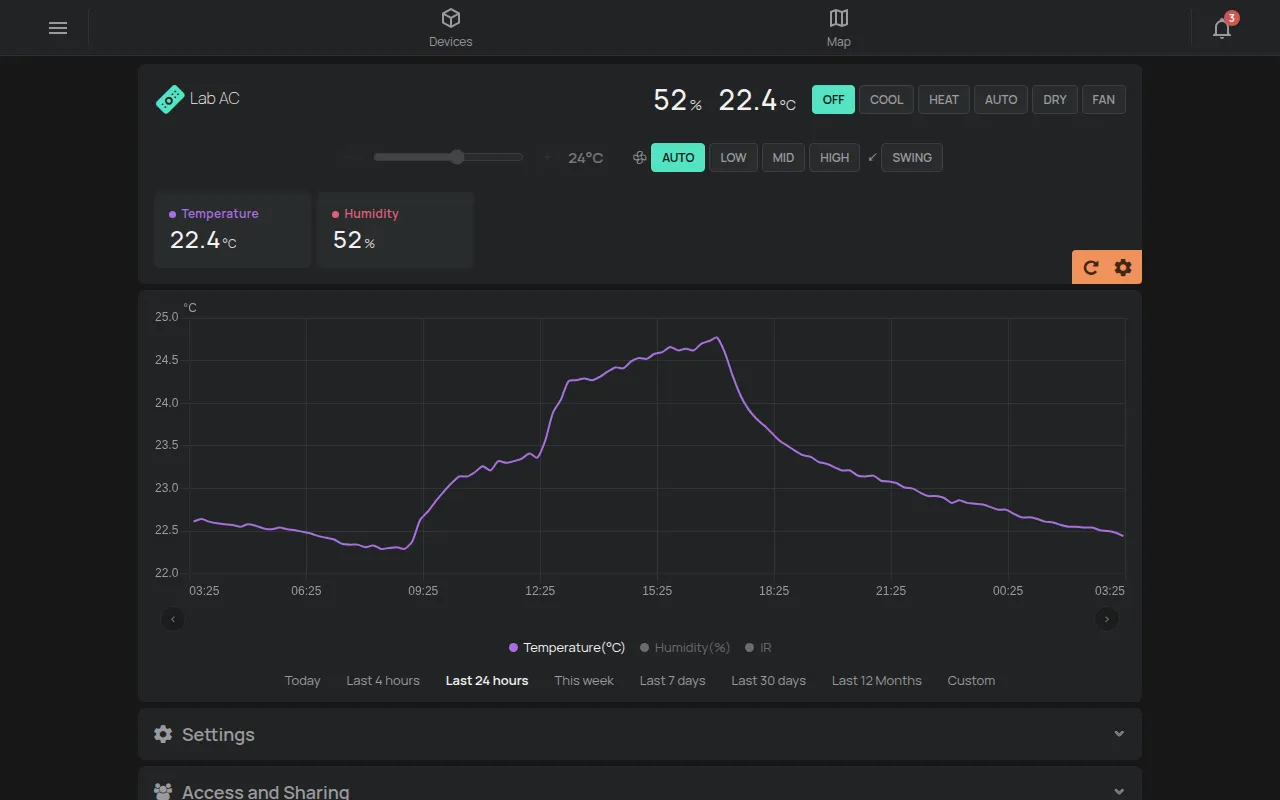
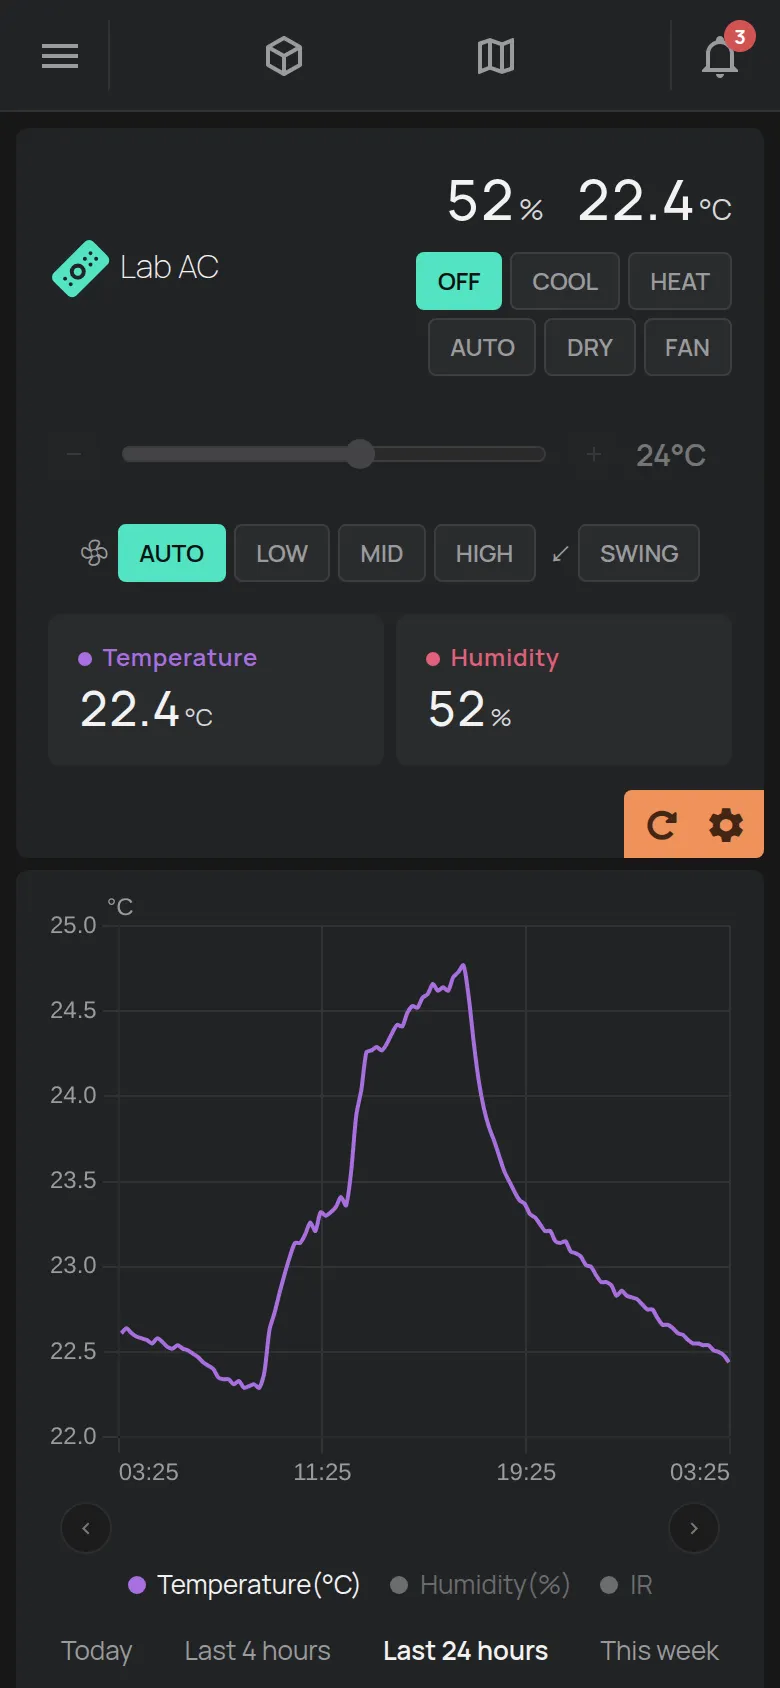
See RemoteAC and output controls.
GPS tracker
Section titled “GPS tracker”The page of a GPS tracker has a map with the route and the stops of the vehicle. It also shows the speed, the distance, the battery voltage and the ignition.
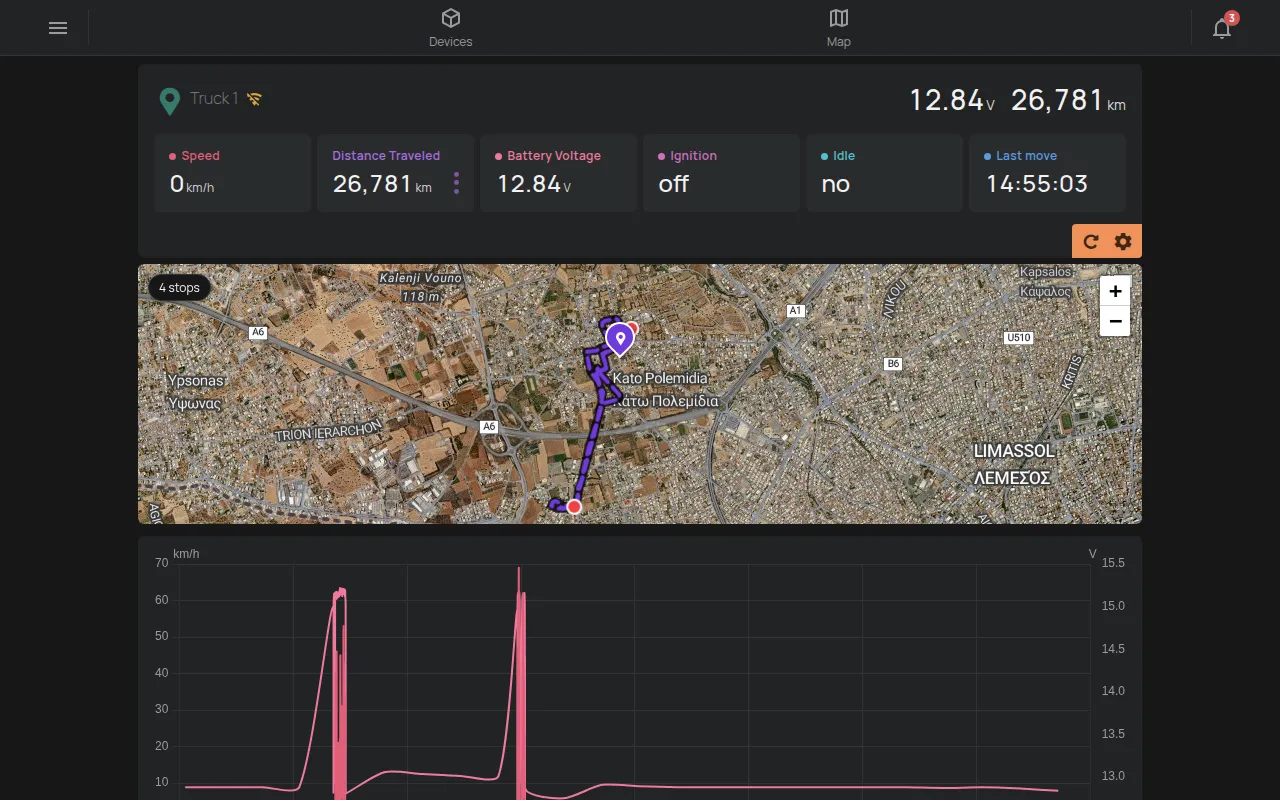
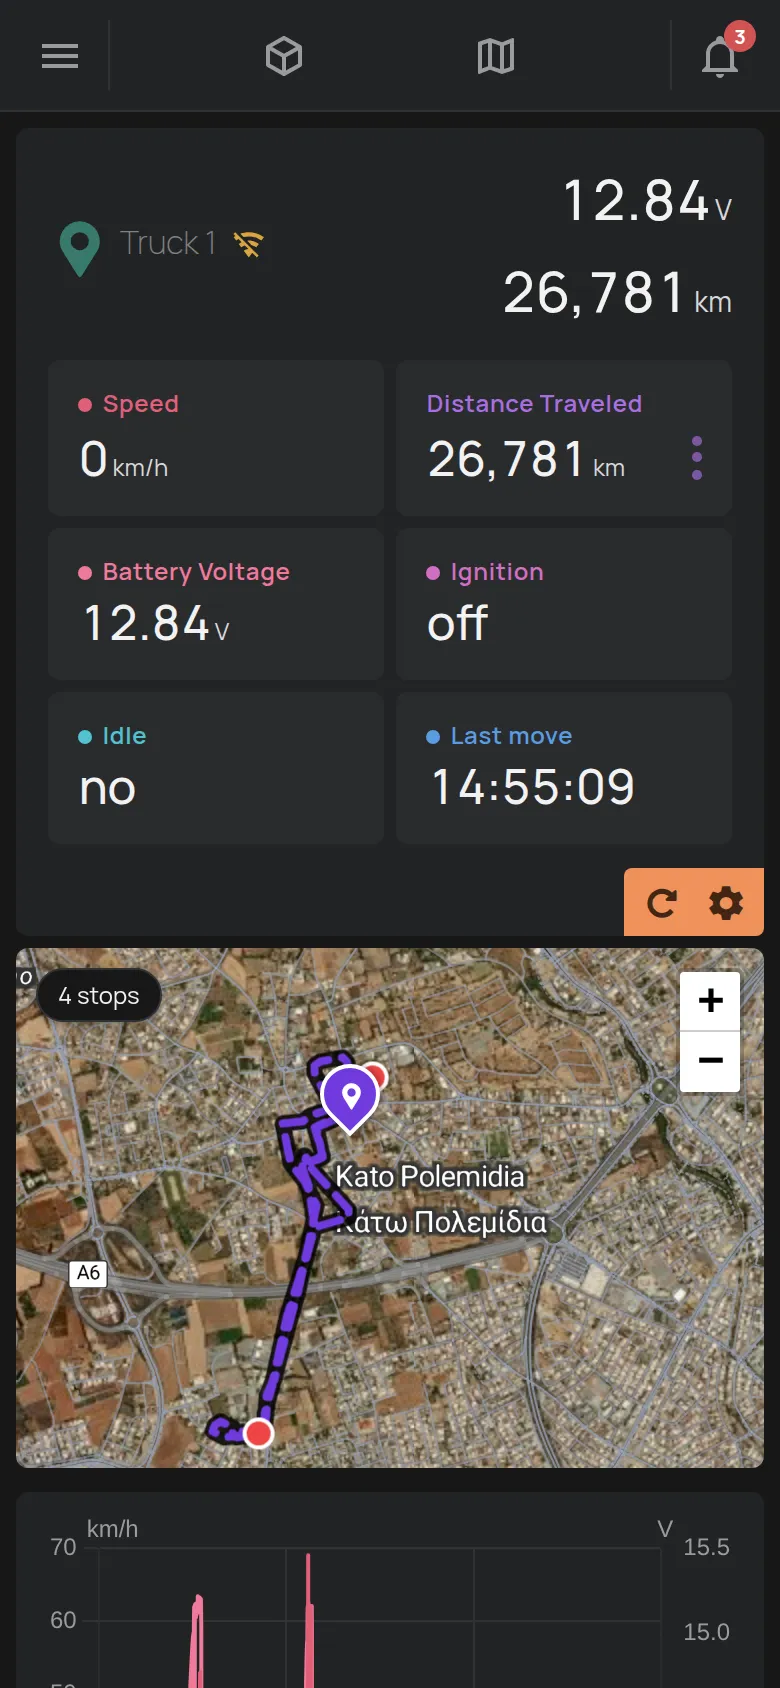
See map and GPS routes and GPS trackers.
Offline device
Section titled “Offline device”When the device is offline, the name is grey and a crossed-out WiFi sign shows next to it. The values are the last ones that the device sent.
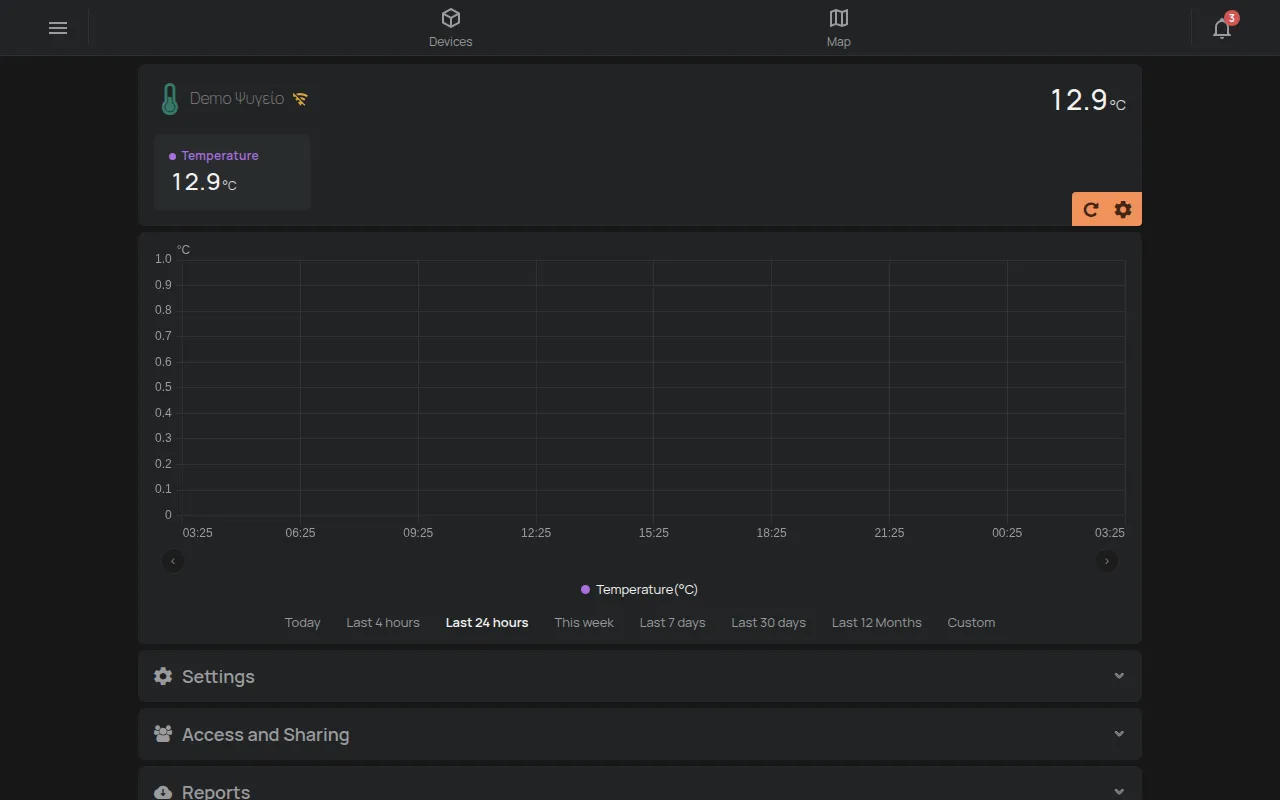
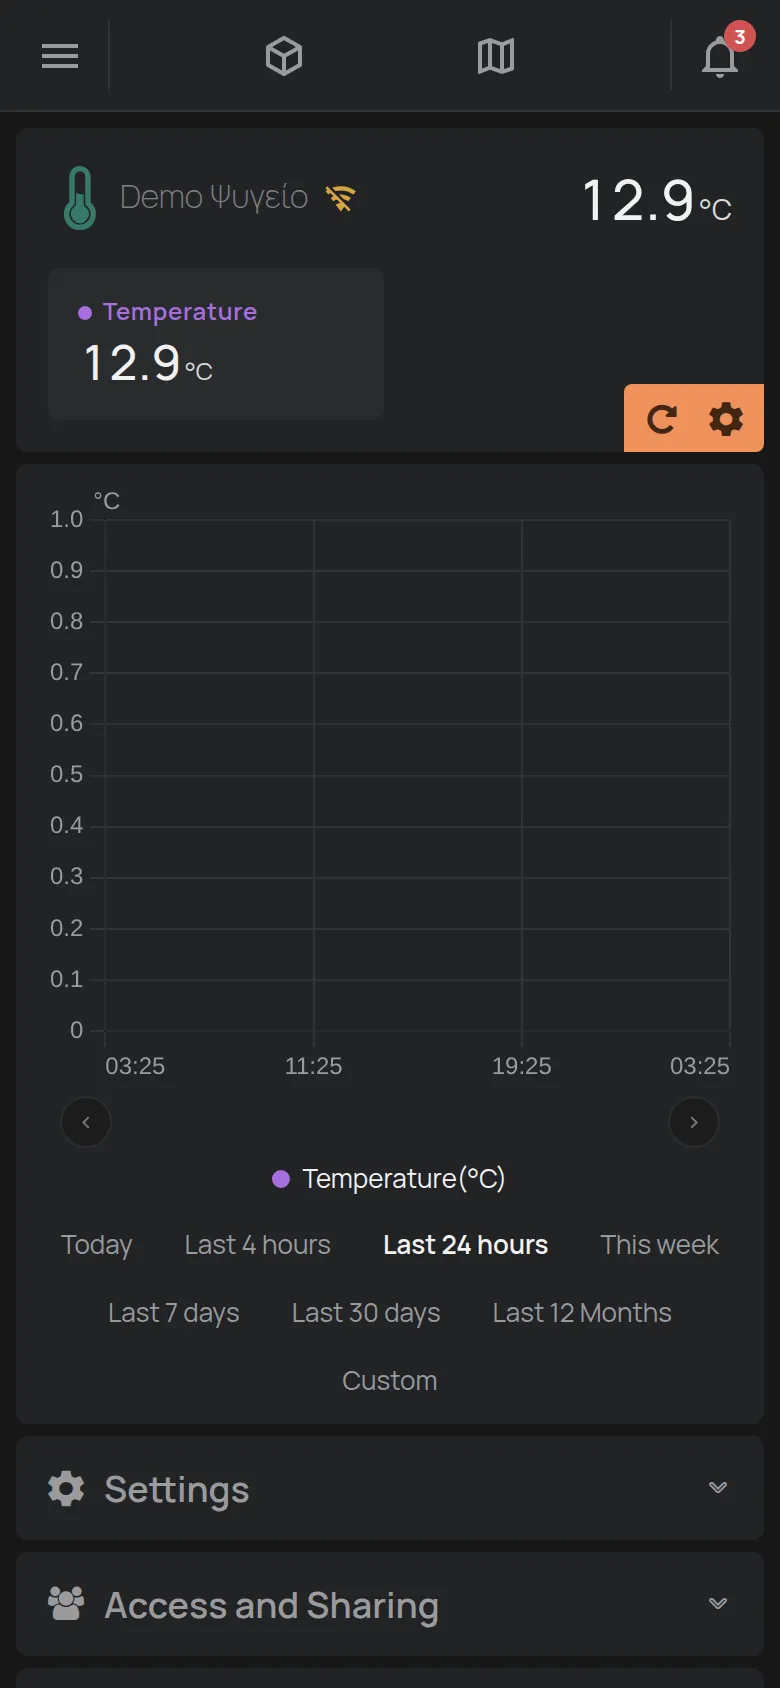
Click the sign to see the Last Connection and the WiFi Network. See what to do when a device is offline.