

Measurement reports (PDF, CSV)
A report is a file with the readings of a device in a time range. You make it from the Reports section of the device page.
The PDF temperature report is the file you give to a health inspection (HACCP). The readings have a date and time, and the app keeps them.
Report for many devices
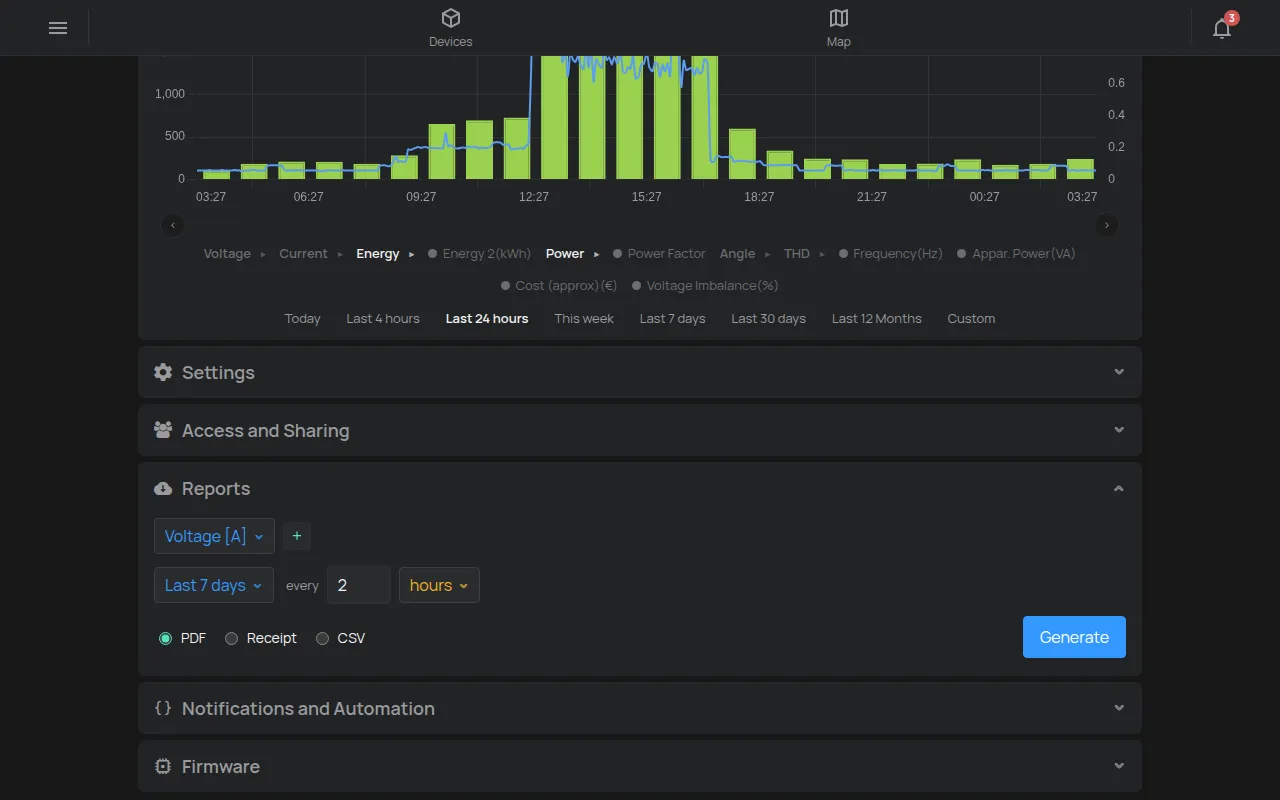
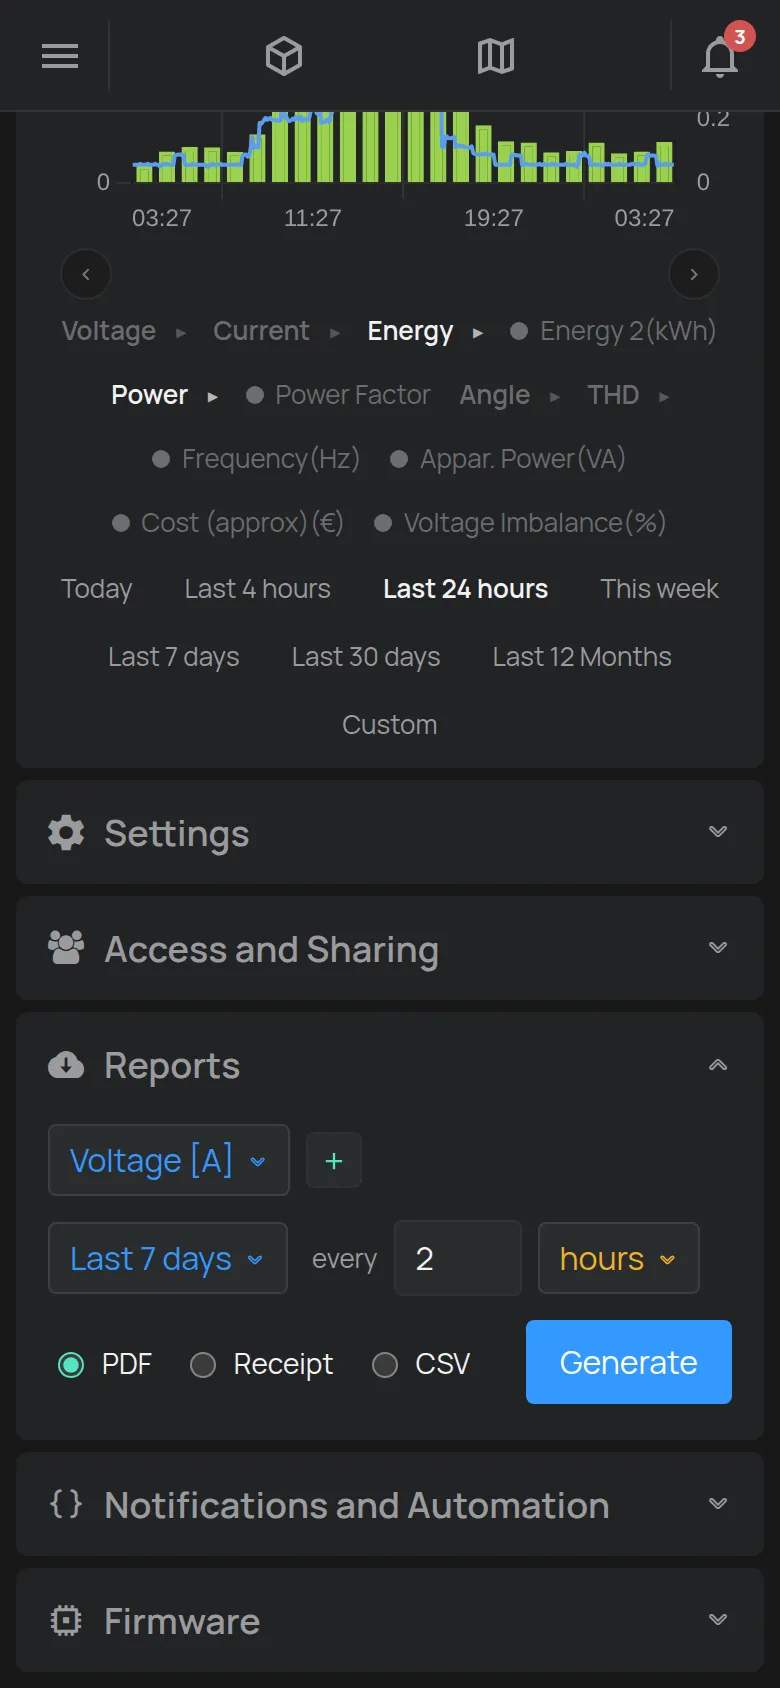
Section titled “Report for many devices”The Combined report makes one file for many devices at the same time. For the inspection of many fridges, this is the fastest report.
- In the device list, open the Tools menu.
- Click Select devices.
- Select the devices.
- Click Reports in the selection bar.
- Select the reading, the range, the step and the format.
- For one file per device, turn on Separate file per device (ZIP).
- Click Generate.
The report opens with Last 7 days, a step of 1 day and the PDF format. Devices with no readings in the range do not show in the file.
The Combined report also opens from the Data page, with the button with the three dots.
Report for one device
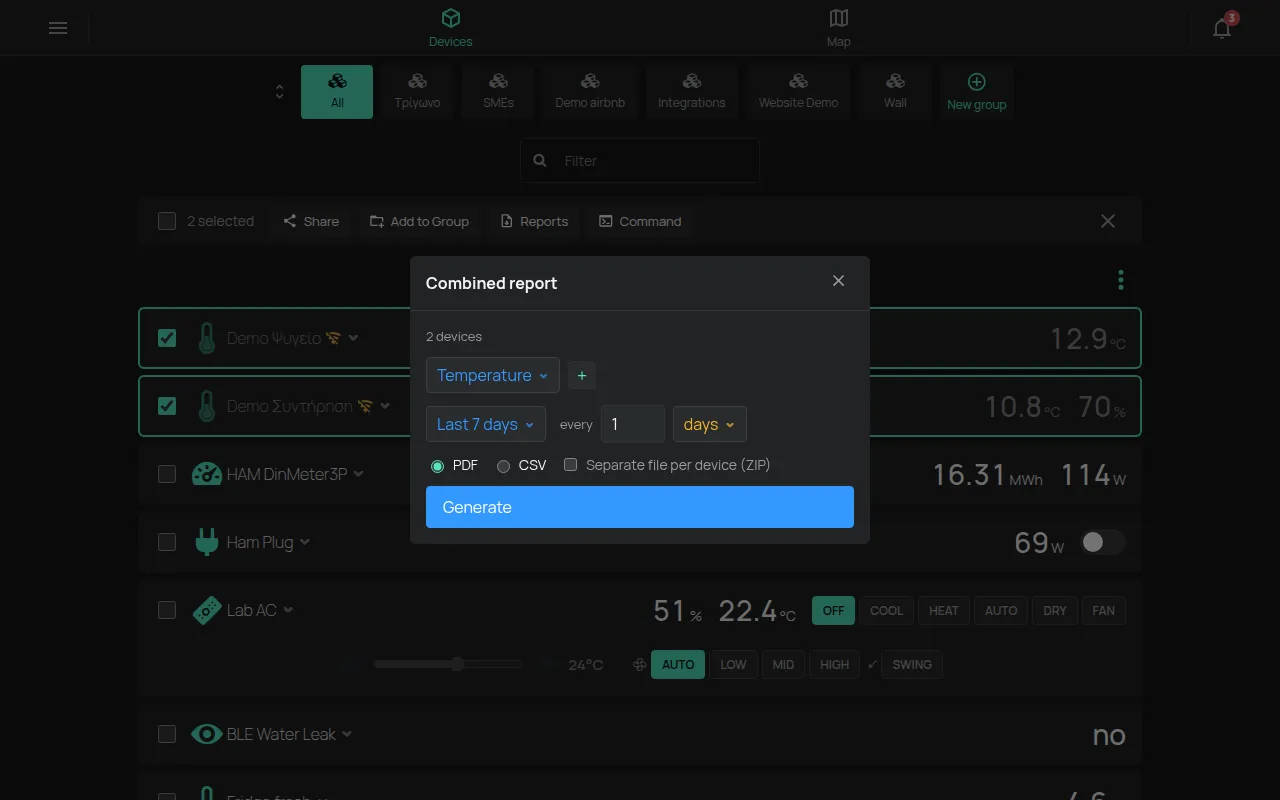
Section titled “Report for one device”- Open the device page.
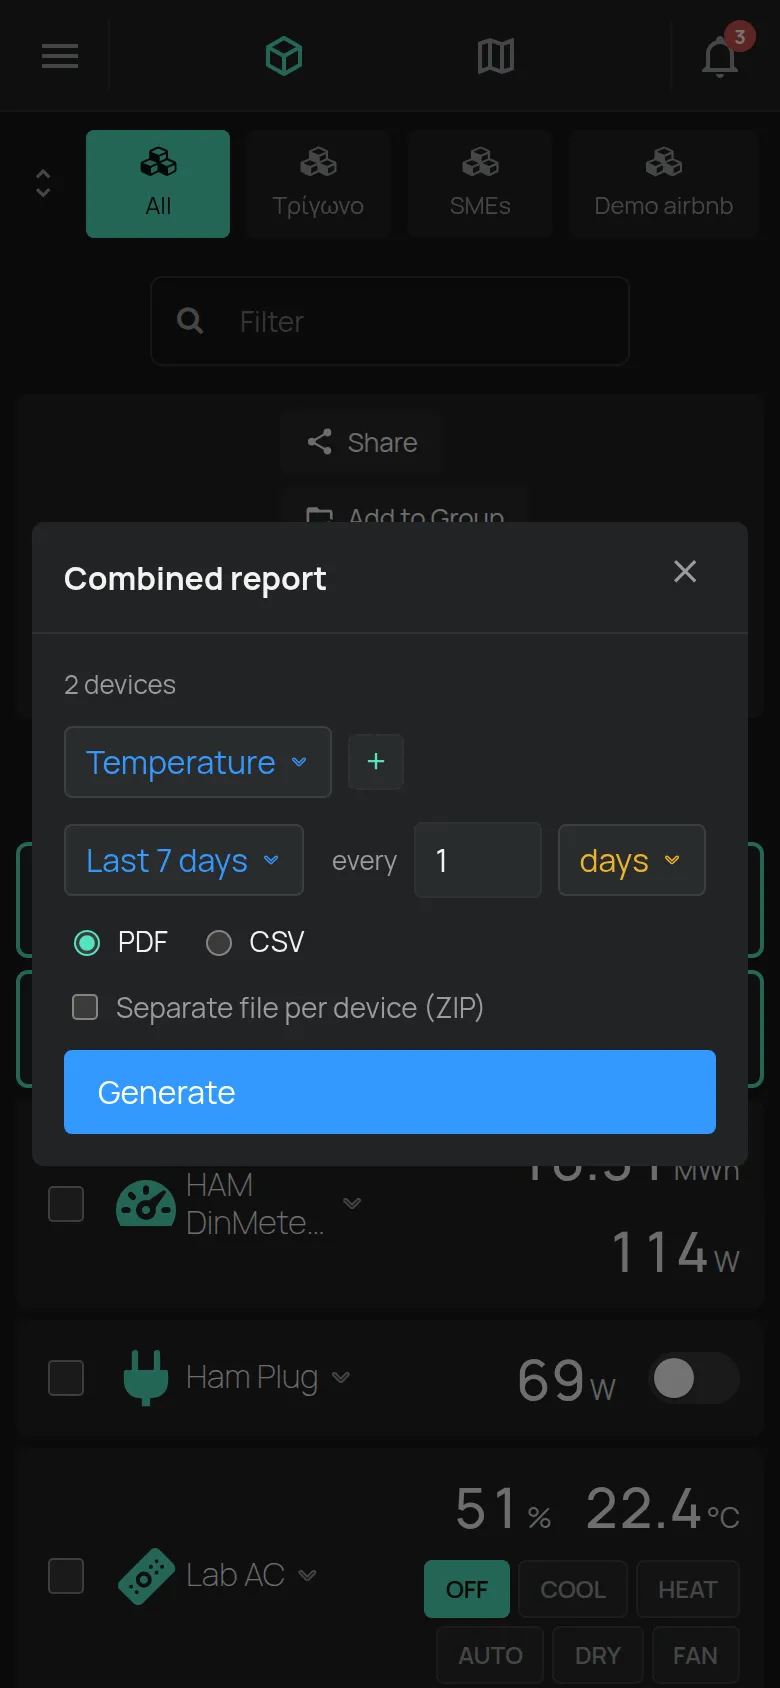
- Open the Reports section.
- Select the reading. The + button adds another reading.
- Select the range, for example Last 7 days.
- In every, select the step, for example 2 hours.
- Select the format: PDF, Receipt or CSV.
- Click Generate.
The app downloads the file. If there are no readings, the app shows “No data for this range”.
Options
Section titled “Options”- Range: from Today to Last 12 Months. Custom sets a start and an end.
- every: the report shows one value for each step, for example one value every 2 hours.
- Raw: in the step list. The report shows each reading that the device sent, with no step. The file has many more rows. Use it for a few days, for example to see what happened during a fault.
- Event based: for on and off readings, for example a door. The report shows only the changes.
Report for the last month
Section titled “Report for the last month”- In the range, select Custom. Two fields show: start and end.
- In the start field, click the calendar. Select the 1st day of the last month and the time 00:00. Click Done.
- In the end field, select the last day of the same month and the time 23:59. Click Done.
- Click Generate.
You can also type the date in the field, for example 2026-09-01 00:00 and 2026-09-30 23:59. For the current month, select This month.
Special reports
Section titled “Special reports”The list of readings also has special reports:
- Activity: when and how the outputs changed, for example from the app, from a rule, from a schedule or from the button on the device. Only for Manage or owner access.
- Stops: the stops of a GPS tracker.
- Tracking: where the BLE tags were. The range is up to 92 days.
File formats
Section titled “File formats”- PDF: for printing and records. It has the logo, the serial number, the name, the Device Description, the time zone, statistics, a chart and a table with the values.
- Receipt: a narrow PDF for a 58 mm thermal printer.
- CSV: for Excel or another program. The delimiter is the comma
,.
The PDF statistics are minimum, maximum, average and sum or median.
Quick export from the Data page
Section titled “Quick export from the Data page”The Data page has the CSV and PDF buttons. They download the readings that you see in the chart. A device that you hid in the legend stays in the CSV file. See charts.
The full history
Section titled “The full history”To export all the data of the account, see your data. For automatic download from another system, see download historical data.